
We like tools like Tableau and Looker for visualizing multi-jurisdictional surveys but AI tools are making it easy to generate visualizations that serve as more than mere eye candy. The serve as useful, deeper-dive tools. Here are a few ways you can get creative with 50 State Surveys.
We began with a Westlaw Advance AI Jurisdictional Survey for Tax and Other Financial Incentives for Video Game Developers. We then uploaded our result to Claude and NotebookLM for additional processing. Vincent vLex from Clio also generated (quickly!) a nice survey on the same topic. For reference and your own testing, we shared that resource below.
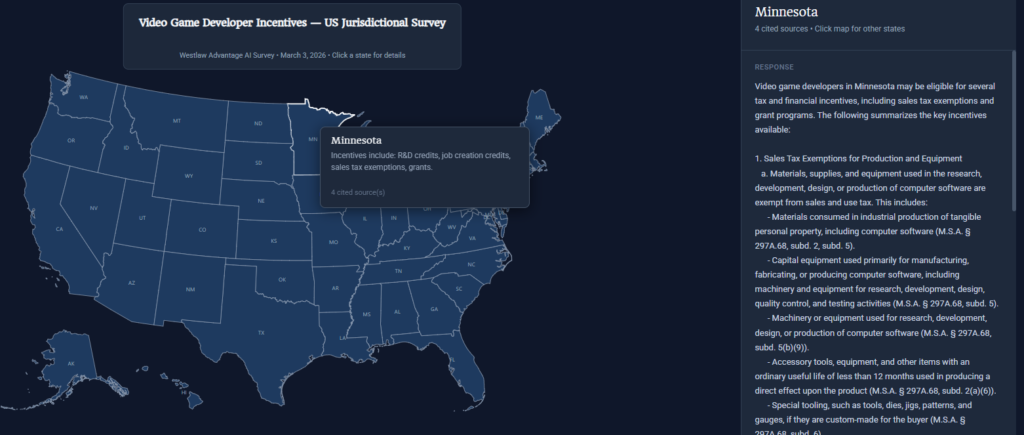
Claude CoWork: Vibe Coded Map and Side Bar
This simple reference tool allows for quick access to summary information in each state. Click to View.
NotebookLM Video Overview
We were surprised by the level of detail provided by the video overview generated by NotebookLM. These are potentially great introductory additions to surveys or training tools. NotebookLM also allows you to create quizzes based on a resource in your library.
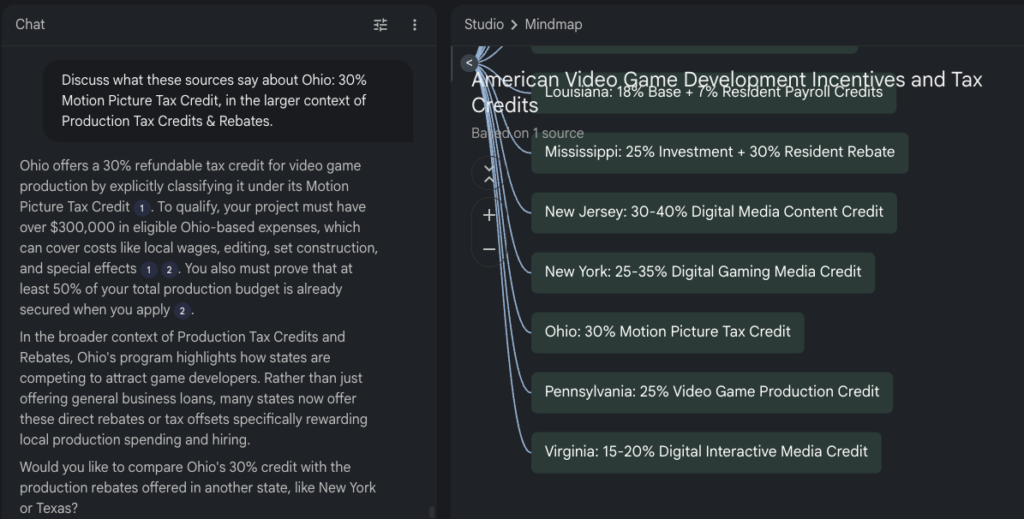
Notebook Interactive Mind Map
The interactive map is the least pretty but probably the most valuable as it provides easy access to both summary and detail information. Summaries are automatically generated at each level of the map and you can query the tool at anytime, at any level of the map. The underlying table can be automatically updated with some simple coding (in sum: an RSS feed from a Westlaw alert to a Google Sheet). Then, you have an up-to-date exploratory, compliance tool. Request Access
Reference: vLex Survey